


Editor’s Note: Now, all our premium tools for Fantasy, DFS and Betting are included in one subscription at one low price. Customers can subscribe to NBC Sports EDGE+ monthly ($9.99) or save 20% on an annual subscription ($95.88). And don’t forget to use promo code SAVE10 to get 10% off. Click here to learn more!
With the exception of a few high level goaltenders, I have found evaluating goalies to be challenging. The technical components, I can appreciate, and concepts like cutting down space, being square to the shooter and using a VH or RVH style but it doesn’t help me understand the impact of goaltending overall. I’ve stayed away from analyzing goaltenders, as a result. Sometimes you have to acknowledge there is a deficiency that isn’t going to be improved without significant investment of time, and move on. That’s what I’ve done..
A common theme is statistics like goals against average (GAA) showing results as more of a team metric, not goaltender specific, which clouds the judgment of impact overall, so it’s unfair to the workload and team level results, to label that statistic as wholly comprised of goaltending talent alone.
Save percentage is a better indicator of performance than GAA, taking into consideration shot (and expanded to shot attempts where applicable), workload and circumstance. For instance, rebounds are tracked at www.moneypuck.com – the source of data for this piece of writing.
When I was constructing team and player level charting for the McKeen’s Yearbook, I found a new appreciation for the statistic of goals saved above expected (GSaX). This shouldn’t be confused with goals saved above average (GSAA), which is less of an advanced stat that measures performance over a broader set of variables. GSAA is defined below, with a good accompanying thread here showing the differences and individual impacts.
“Goals Saved Above Average is calculated by the league’s average save percentage with the number of shots a goalie has had. The resulting number is the average goals a goalie in whatever league you’re evaluating would’ve surrendered if they took the same number of shots as the goalie you’re evaluating.
Then, this number can be evaluated against the number of goals given up by the goalie in question, finally resulting in a plus / minus number, GSAA.”
To complete the Yearbook work, I set up an interactive goaltending Tableau page, which has been updated and can be located here. There’s a slider to pick games played range and you can choose an individual team to focus on goaltenders, with the non-selected goaltenders faded into the background.
The Tableau page is configured with rate statistics (on a per 60 minutes basis instead of a raw count that skews smaller sizes into bigger impacts). Expected goals against (xGA) per 60 minutes is plotted along the horizontal axis, and goals saved above expected (GSaX) per 60 minutes along the vertical axis. All values are at 5v5 – to eliminate special teams effects on a perceived competence of defensive ability. The image below shows the entire dataset plotted into the chart, with quadrants marked to gauge performance.

Goals Saved Above Expected Tableau
With league average around 15 games, this is the filter for a minimum of 10 games played.

Goals Saved Above Expected Tableau 10 GP Minimum
From this image Logan Thompson appears in the far bottom left corner, very close to the label, with Louis Domingue and Ville Husso in the opposite, upper right quadrant, indicating a heavy workload with good results. Husso of the Blues has appeared in 16 games, while Thompson and Domingue have played one game each – and an important lesson about sample size driving metrics wonky at the extremes.
Goaltending was a major concern entering the 2021-22 season for the Toronto Maple Leafs, but they benefitted greatly early on, with stellar play of Jack Campbell. Some early season Vezina whispers, fizzled as the season wore on, as more average and less performances since the beginning of December left the Leafs struggling between the pipes at times. Petr Mrazek was supposed to complete the tandem pairing with Campbell, but with an extended injury absence over the first half, Campbell shouldered most of the goal crease workload, and together they have performed average, while the Leafs have allowed around the league average expected goals against rate.

Goals Saved Above Expected Leafs
Petr Mrazek has played 428 minutes in another injury-plagued season. During the offseason, Mrazek placed very favorably on this scale and seen as an early indicator to why the Leafs decided to sign him to a contract. Fragility aside, his role is to be a secondary option that could rise to the main job should injury or fall from grace sully the stellar early, yet stinky, lately, play of Jack Campbell.
With over 1,600 minutes, Campbell’s ice time dwarfs Mrazek’s and sits just above the average mark in GSaX, while Mrazek lands just below the league average.
Replacing Mrazek in Carolina was Frederik Andersen – so to speak, they only changed uniforms but Mrazek wasn’t really the Canes starter. Andersen, the former Ducks and Leafs standout has been lights out for the Hurricanes this season and is a justified entrant into the upper right quadrant. He’s provided a sense of stability in the crease that he showed early on in his Leafs career and the standout performances have given the Hurricanes options to experiment and initiate their potent offensive strategies, knowing there’s less concern over mediocre netminding. As a whole, the Canes goaltending has performed well above expectation, with Anti Raanta appearing in the same upper right quadrant – albeit with a small sample size of nine games.
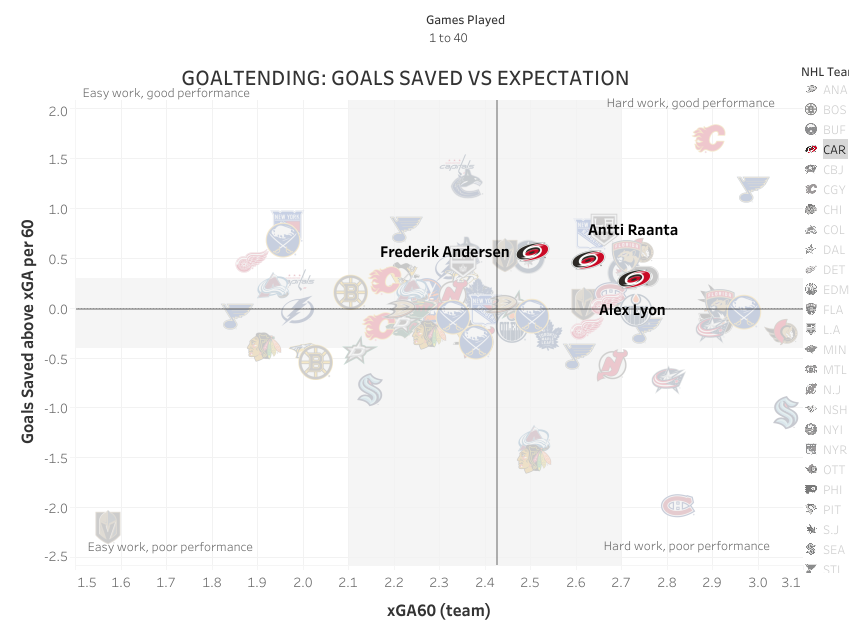
Goals Saved Above Expected Frederik Andersen
Much maligned goaltender in the shortened 2020-21 season, Carter Hart has seen an improvement overall, and despite the Flyers allowing a high rate of expected goals against per 60, he’s placed his GSaX per 60 minutes above the NHL goaltender average.
Hidden just above the fold in the hard work, good performance quadrant, the Flyers netminder’s rebound hasn’t coincided with overall defensive improvement from the Flyers defense after off season tinkering airlifted Keith Yandle and Rasmus Ristolainen to spur a blueline resurgence. In 2021-22, the Flyers are ranked third last in shot attempts against per 60 minutes.

Goals Saved Above Expected Carter Hart
The familiarity with expected goals (the mathematical representation of ‘shot quality’ in relation to how many goals a goaltender has allowed (per 60 minutes) gives us a very unique view of their overall performance above and beyond shot quantities. Hockey is a complex sport that requires positional dedication to limit risk in scoring against, but that last line of defense can be measured better by incorporation statistics that contain elements of shot quality.
Stop using goals against average to assess goaltenders altogether would be an improvement – or at least attribute that statistic to team level play. Focusing on individual save percentage (or based on location, like low, medium and high danger areas), and coupled with GSaX give a more rounded view of a goaltender’s impact to team success. Hopefully this little primer will further along your curiosities to explore new goaltending statistics.
