


The App is Back! Don’t forget to download the NBC Sports EDGE app to receive real-time player news, mobile alerts and track your favorite players. Plus, now you can check out articles and player cards. Get it here!
The margin for error in fantasy football is either really big or really small depending on how you choose to think about it.
On one hand, you can whiff on a lot of your picks and still win your league. For example, look at the winning team from last season’s Best Ball Mania tournament. Establish The Run’s Justin Herzig took home the $200,000 prize after finishing first out of 43,200 teams.
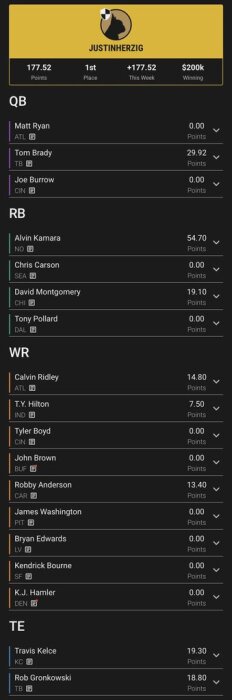
Best Ball Mania – along with most best ball tournaments and redraft leagues – doesn’t crown the overall highest-scoring team as the champion. Rather, entrants are placed into 12-team leagues and the top-two finishers during the fantasy regular season advance to the tournament stage. From there, the best teams in each week progress to the next stage. It’s like a regular 12-team league followed by three GPP-style tournaments, and then the winner is crowned during the second-to-last week of the NFL season (Week 16 in 2020, Week 17 in 2021). Herzig’s team was undeniably stacked, but he also didn’t nail every pick. Joe Burrow, T.Y. Hilton, John Brown, James Washington, and Bryan Edwards disappointed relative to ADP. Other guys like Matt Ryan and Tyler Boyd had merely acceptable seasons. That’s what I mean when I say you have a large margin for error: You can win hundreds of thousands of dollars – and literally finish first out of tens of thousands of teams – and still get a lot wrong.
At the same time, you also don’t have much room for error because there are only a handful of league-winners each season, and your chances of winning decrease dramatically if you don’t have at least one of them. You need the 2019 Christian McCaffrey-type season. You need Alvin Kamara to score six touchdowns on championship weekend. In fact, Herzig was the only team with Kamara in the final stage last year. Kamara’s outburst in combination with that kind of uniqueness was a major driving force behind his victory.
Anecdotally, it seems like the fate of fantasy football seasons is driven mostly by a small percentage of players. Today, we’ll dig into the numbers to see if that hypothesis is borne out by data.[[ad:athena]]
By the Numbers
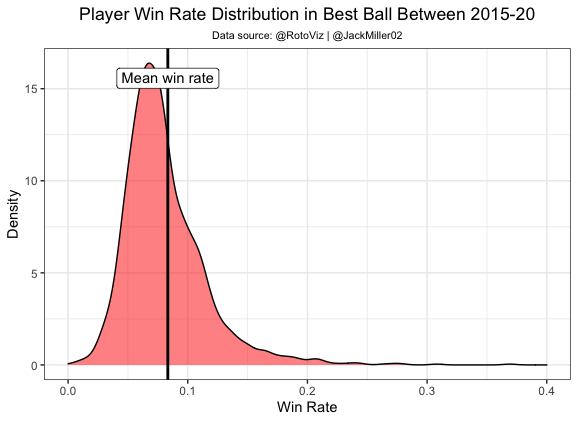
Over the past six seasons, the median win rate is just 7.5%. Only 36.5% of player seasons have been above the expected win rate of 8.3%. We use 8.3% as a baseline because it’s 100 percentage points divided by 12 teams per league.
What this means is most players don’t live up to expectations. The average win rate is dragged up by high-end performers. Looking at the distribution of win rates since 2015 makes this even more evident.
This isn’t unique by position either. All positions have a similar positively skewed distribution, although it is most extreme at running back. Let’s go one at a time, starting with quarterback, which has a 7.5% median win rate and 35.8% hit rate since 2015.

RB sports the lowest median win rate (7.3%) and hit rate (33.8%). This shouldn’t come as a surprise considering the boom-or-bust nature of the position. Pat Kerrane’s most recent article touched on how early-round RBs need legendary upside to be worth the cost of admission. Basically, RBs bust at an extreme rate, especially compared to WRs. We see this in full display in their win rate distribution.

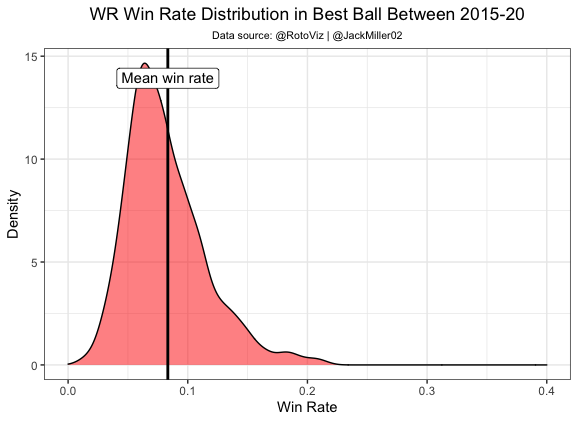
On the flip side, wide receivers have the best median win rate and hit rate at 7.6% and 39.8%, respectively. Given what we learned from Kerrane’s article, this isn’t very surprising.
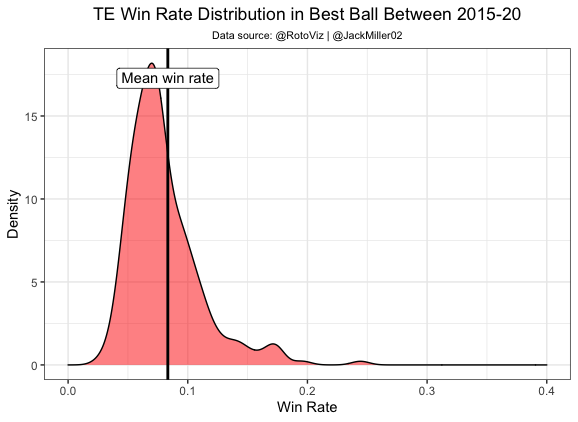
Tight end is nearly as bad as RB, with a 7.4% median and a 33.9% hit rate.
If win rates were distributed normally, the median would be the same as the mean and approximately half of the player pool would post an above-average win rate. The actual numbers show a clear right skew, indicating that most players underperform ADP. Just to be sure we’re not missing anything, we can also look for any changes year-over-year, but there don’t appear to be any trends.

All of this helps validate the idea that fantasy leagues are decided by a small number of players. With that in mind, we should dedicate most of our energy to identifying players who have access to a league-winning ceiling. On its own, that’s not very helpful – draft players who can crush ADP, more at 11 – but there are steps we can take to increase our odds of finding them.
Editor’s Note: Get an edge on draft day with our 2021 Draft Guide that is packed with hundreds of player profiles, rankings for various formats, projections, tiers, mock drafts, custom scoring, our ADP Trend Report tool and more. And don’t forget to use promo code SAVE10 to get 10% off. Click here to learn more!
What Does “Upside” Mean?
Upside wins championships. Not only does our data show that, but it also just makes sense because you have to finish first out of 12 (or however many) teams. If you’re drafting for floor, you probably won’t finish in last place, but you’re also decreasing your probability of winning the championship. This idea has been discussed numerous times over the years, but to be actionable we need to hone in on strategies to find potential league-winners.
Before we get into the weeds, I want to clarify that you’re not going to hit on every pick. That’s okay. Because leagues are decided by only a handful of league-winners, we should be hoping for a couple of players who greatly outperform ADP rather than a team full of guys who didn’t bust.
The one concern is that we might not be that good at predicting how much upside someone has. Most upside-centric analysis is narrative-based; if X happens, Player Y can do Z. That’s necessary because it’s difficult to quantify different possibilities for a player in foresight, but it’s still helpful to know what you’re looking for. We can use quantile regression to get a rough idea of different percentile outcomes by ADP. Let’s look at QBs first.

Now the same thing but for RBs. Elite RB1s have the most game-breaking potential in fantasy, but it’s still jarring to see how many points they score on the high end. This reinforces what Kerrane wrote last week; no position has as wide of a gap between the 95th percentile and the median, so early-round RBs really need to boom to be worth it because the median performance is a massive downgrade from the elites.

We’ll look at WRs next. Elite wideouts typically don’t have the same league-winning potential as RBs, so it’s no surprise that the blue line isn’t as steep. High-end WRs are safer – the smaller gap between the 95th percentile and median indicates they don’t need to crush ADP to be worth it – but they also don’t have the ability to break fantasy football like RBs.

Last (and probably least) is the TE position. Keep in mind there aren’t many TEs who get drafted early in fantasy drafts, so the left side of the graph is basically looking at how Rob Gronkowski, Travis Kelce, and George Kittle (plus a couple of others, such as Zach Ertz and Mark Andrews) have done over the past six years.

Leagues are won by a small group of players, and we should spend most of our time trying to identify those guys. To do that, you need to know what “upside” means, so these plots can inform your judgment on whether someone has league-winning potential.
Projections vs. Range of Outcomes
Projections show the most likely outcome for a player.
Here’s the thing: We just showed the most likely outcome for any player is that they underperform relative to ADP.
We can use that to our advantage, especially since many fantasy players heavily rely on projections when drafting. A player can look like a value when comparing projections to ADP, but that doesn’t mean you should draft him because projections don’t capture the full range of outcomes. We need players with the potential to significantly outperform what’s expected of them.
The issue is it’s difficult to quantify a player’s range of outcomes unless you’re simulating the season thousands of times. RotoViz co-owner Shawn Siegele has written about the idea of “scenario-based drafting,” in which you envision the different ways a season could play out and consider how each scenario would impact a player’s value. It’s a useful exercise, although it’s important to not get carried away with confirmation bias (i.e. if you like a player, it’s easier to tell yourself a story about how he returns value).
It should be noted that well-established players in certain situations have a narrower range of outcomes. For example, Adam Thielen is entering his eighth season with the Vikings and his third catching passes from Kirk Cousins. Minnesota’s offense will once again be centered around Dalvin Cook. He’s now competing with Justin Jefferson for targets instead of Stefon Diggs, but he’s generally in the same role as previous seasons. Age is a concern, but you can be relatively certain of what Thielen will give you when he’s on the field.
On the other hand, Travis Etienne is a rookie running back on a team with a brand-new coaching staff and quarterback, plus we don’t know how much James Robinson is going to be used. We don’t really even know if the Clemson product is going to be used as a traditional RB or a gadget player.
We can’t be sure of much with Etienne, so a projection probably isn’t the best way to determine his value. However, most projections have him in the neighborhood of his RB23 ADP on Underdog. Because of that, he’s probably undervalued (at least positionally) in drafts because the lack of certainty in his situation gives him a wider range of outcomes. On the whole, uncertain players whose median outcome indicates their ADP is fair immediately have some appeal due to their broad range of outcomes.
You can almost use projections as a weapon by recognizing how imperfect they are. Given that a small number of players have an outsized impact on the fantasy season (i.e. those who significantly outperform expectations), it’s far superior to think about each player using a range of outcomes.
Structural Drafting
The reason we emphasize structural drafting is that it increases the chances of hitting on league-winning players. “Pick the right players” is rightfully treated as a joke at this point, but that’s what fantasy is about at the end of the day.
It’s just that it’s been shown time and time again that player selection is difficult. That’s why we rely on structural drafting to build our teams in a manner that has increased the probability of drafting league-winners in the past. Elite TEs, the RB dead zone (although RB ADP is starting to shift), getting WR production early – it’s easy to get so lost in the grind of hunting for these edges that we lose sight of the fact that we do it because it increases the odds of picking the right players. In other words, we know we aren’t that good at picking out which players are undervalued, so we look for macro-level trends that tell us which groups of players have produced high-end seasons in the past.
Kerrane recently made a great point that fits here: “When you have identified a macro edge, it is important not to waste that edge by becoming overly specific in player selection.” We aren’t that good at this. Only 36.5% of player seasons have had an above-average win rate since 2015! By adhering to the tenets of structural drafting, we automatically increase our probability of pinpointing league-winners without even thinking about the player selection aspect.
Closing Remarks
We’re not reinventing the wheel here. I’m just reinforcing the value of scenario-based drafting and roster construction from a different perspective using best ball win rate distributions.
The fate of your fantasy football season is mostly driven by only a few players. On the whole, you have a lot of wiggle room to get things wrong as long as you’re right in a few important spots. That should guide your drafting philosophy this summer.
